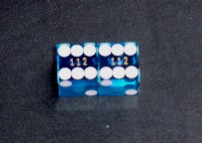
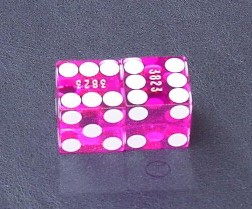
This data is for the straight sixes come-out set:
The Dice Were Thrown 432 times

(May, 2001)
| Number | # of Times Thrown | # of Times Expected in 432 rolls | Variance From Expected | Converted to 36 Rolls |
| 2 | 13 | 12 | 8.3% | 1.1 |
| 3 | 24 | 24 | 0% | 2.0 |
| 4 | 27 | 36 | -25% | 2.3 |
| 5 | 39 | 48 | -18.8% | 3.3 |
| 6 | 74 | 60 | 23.3% | 6.2 |
| 7 | 94 | 72 | 30.6% | 7.8 |
| 8 | 59 | 60 | -1.7% | 4.9 |
| 9 | 37 | 48 | -22.9% | 3.1 |
| 10 | 28 | 36 | -22.2% | 2.3 |
| 11 | 23 | 24 | -4.2% | 1.9 |
| 12 | 14 | 12 | 16.7% | 1.2 |
| 432 | 36 |
| Hardways | # of Times Thrown | # of times expected in 432 rolls | # of times expected based on the actual occurrence of the 4,6,8,10 * | Variance |
| Hard 4 | 16 | 12 | 8.9 | 79.6% |
| Hard 6 | 17 | 12 | 14.8 | 14.9% |
| Hard 8 | 8 | 12 | 11.8 | -32.2% |
| Hard 10 | 12 | 12 | 8.4 | 42.9% |
* based on the total appearance of the actual number. (For instance the 4 can be made three ways, 1/3 – 3/1 and 2-2. So for every 3 appearances of the 4 one third of them should be a hard way. I threw the four 27 times. Multiply 27 times 1/3 to get 8.9)
The Good News: The intention of this set is to throw the seven more frequently, and the data demonstrates my success. Since the 12 and the 2 are also on this axis, the increased appearance rate for those two numbers is not surprising. The other good news is the reduction in the appearance of the 4 and 10 on the come out since they are more difficult to throw when they are the point. When I DID throw the 4 and 10, I threw them as hardways at a much higher than expected rate.
The Bad News: Though I reduced the appearance of the 5 and 9, in theory with this set, there should be no appearances. Of course this is not possible, but I would expect an even lower occurence of them. In addition, I would expect a higher appearance rate of the 11 and the 8. There are no expected hard 6’s or 8’s for this set, yet I still threw them.
Opportunities: In addition to the seven, the increased occurrence rates of 2 and 12, and craps in general suggest some whirl (world) bet opportunities. Combined average of naturals & craps: 14 of 36 or 39% of the time on come out in comparison to the expected appearance rate 12 of 36 (33.3%). Definitely bet the hard 10 and hard 4 on come out.
This set of data is for the crossed sixes set

| Number | # of Times Thrown | # of Times Expected in 540 rolls | Variance | Converted to 36 Rolls |
| 2 | 16 | 15 | 6.7% | 1.1 |
| 3 | 32 | 30 | 6.7% | 2.1 |
| 4 | 46 | 45 | 2.2% | 3.1 |
| 5 | 72 | 60 | 20% | 4.8 |
| 6 | 60 | 75 | -20% | 4.0 |
| 7 | 74 | 90 | -17.8% | 4.9 |
| 8 | 81 | 75 | 8% | 5.4 |
| 9 | 59 | 60 | -1.7% | 3.9 |
| 10 | 55 | 45 | 22.2% | 3.7 |
| 11 | 35 | 30 | 16.7% | 2.3 |
| 12 | 10 | 15 | -33.3% | .7 |
| 540 | 36 |
| Hardways | # of Times Thrown | # of times expected in 540 rolls | # of times expected based on the actual occurrence of the 4,6,8,10 * | Variance |
| Hard 6 | 16 | 15 | 12 | 25% |
| Hard 8 | 14 | 15 | 16.2 | -15.7% |
| Hard 10 | 18 | 15 | 18.2 | -1.1% |
* based on the total appearance of the actual number. (For instance the 4 can be made three ways, 1/3 – 3/1 and 2-2. So for every 3 appearances of the 4 one third of them should be a hard way. I threw the four 46 times. Multiply 46 times 1/3 to get 15.2)
The Good News: The intention of this set is seven avoidance, and to a certain degree, I was successful. I did not throw with consistency and my data indicates such. This was also a lesson in concentration. In trying to throw the dice 540 times, I grew tired and I became less deliberate with my throwing technique. Because of that fatigue, I threw the seven 5 times in the last 20 throws or so. The higher appearance rate for the five is expected and the data supports the expected outcome. The data indicates that I threw point numbers on average in 25 of 36 throws (69.4%) in comparison to the expected appearance rate of 24 of 36 (66.7%). Though these are not stellar numbers, between 7 avoidance and hitting point numbers, I have easily overcome the house advantage.
The Bad News: Trash numbers, lots of them. This set has a propensity for them and I complied but in a way a bit inconsistent with what is expected with this set. There should have been a higher appearance rate for the 12. There are no theoretical hardways for this set, yet I still threw plenty of them, especially the hard 6.
Opportunities: The prospect for some proposition bet parlay action as I generally threw trash numbers in groups.
This set of data is for the crossed sixes set

July, 2001
| Number | # of Times Thrown | # of Times Expected in 540 rolls | Variance | Converted to 36 Rolls |
| 2 | 17 | 15 | 13.3% | 1.1 |
| 3 | 30 | 30 | 0% | 2 |
| 4 | 46 | 45 | 2.2% | 3.1 |
| 5 | 67 | 60 | 11.7% | 4.5 |
| 6 | 80 | 75 | 6.7% | 5.3 |
| 7 | 68 | 90 | -24.4% | 4.5 |
| 8 | 75 | 75 | 0% | 5 |
| 9 | 75 | 60 | 25% | 5 |
| 10 | 39 | 45 | -13.3% | 2.6 |
| 11 | 30 | 30 | 0% | 2 |
| 12 | 13 | 15 | -13.3% | .9 |
| 540 | 36 |
| Hardways | # of Times Thrown | # of times expected in 540 rolls | # of times expected based on the actual occurrence of the 4,6,8,10 * | Variance |
| Hard 4 | 19 | 15 | 15.2 | 20% |
| Hard 6 | 15 | 15 | 16 | -6.7% |
| Hard 8 | 12 | 15 | 15 | -25% |
| Hard 10 | 8 | 15 | 13 | -62.5% |
* based on the total appearance of the actual number. (For instance, the 4 can be made three ways, 1/3 – 3/1 and 2-2. So for every 3 appearances of the 4 one third of them should be a hard way. I threw the four 46 times. Multiply 46 times 1/3 to get 15.2)
The Good News I made significant improvement in avoiding the seven! Threw with much more consistency as my data indicates such. The data indicates that I threw point numbers on average 25.5 of 36 throws (70.8%) in comparison to the expected appearance rate of 36 (66.7%). I was able to throw the 6,8 and 9 individually more times than the seven appeared. Other than the anomaly of throwing the hard 4, the reduction in hard ways reflects more success in keeping the dice on the axis.
This set of data is for the crossed-sixes set

April 2002
| Number | # of Times Thrown | # of Times Expected in 540 rolls | Variance | Converted to 36 Rolls |
| 2 | 14 | 15 | -6.7% | .9 |
| 3 | 33 | 30 | 10.0% | 2.2 |
| 4 | 53 | 45 | 17.8% | 3.5 |
| 5 | 66 | 60 | 10.0% | 4.4 |
| 6 | 77 | 75 | 2.7% | 5.1 |
| 7 | 59 | 90 | -34.4% | 3.9 |
| 8 | 79 | 75 | 5.3% | 5.3 |
| 9 | 52 | 60 | -13.3% | 3.5 |
| 10 | 46 | 45 | 2.2% | 3.1 |
| 11 | 37 | 30 | 23.3% | 2.5 |
| 12 | 24 | 15 | 60.0% | 1.6 |
| 540 | 36 |
| Hardways | # of Times Thrown | # of times expected in 540 rolls | # of times expected based on the actual occurrence of the 4,6,8,10 * | Variance |
| Hard 4 | 17 | 15 | 17.7 | -3.9% |
| Hard 6 | 20 | 15 | 15.4 | 29.9% |
| Hard 8 | 10 | 15 | 15.8 | -36.7% |
| Hard 10 | 17 | 15 | 15.3 | 11.1% |
* based on the total appearance of the actual number. (For instance, the 4 can be made three ways, 1/3 – 3/1 and 2-2. So for every 3 appearances of the 4 one-third of them should be a hard way. I threw the four 53 times. Multiply 53 times 1/3 to get 17.7)
The Good News: If you don’t think continued practice helps, think again. I’ve made significant headway in seven avoidances. Threw with much more consistency, reducing the appearance of the seven to 1 in every 9.15 throws. (or less than 4 sevens per 36 throws)
The Bad News: First there are the hard ways. Very odd that the hard 6 and 10 came up so often. The lack of appearances of the number 9 is indicative of the choices I’ve made as to which faces I’ve got pointed up and down the table. (I was consistent with the 540 throws which faces I had pointed down the table) If I were to adjust those, I’m sure I would again see a preponderance of nines. Most importantly though, with stronger execution, I’ve proven the weakness of the crossed sixes set. That being TRASH numbers. The better I’ve become at throwing this set, the higher the percentages of trash. This has given me pause to reconsider using a different set. Perhaps it’s time to re-visit the V-3s or to FINALLY give the V-2s a good test.
And for something a little different
I also use wincraps as a tool in my practice routine. Using the “roll your own” function, I threw 200 hands at the table in the simulation. Here are the results:
Number of hands: 200
Longest Number of Rolls: 41
Average Number of Rolls: 9.6
Most Passes: 13
Average Number of Passes: 1.4
Overall Advantage Over The House: 4.38%
Think of it this way. If you say on average, you’ll get four chances to throw the dice in every session you play, 200 hands represent 50 sessions. Frankly, I’d be very happy to maintain a better than four percent advantage over the house in my next fifty sessions.
This is data that I posted in the July/August 2004 Newsletter
Below you’ll find data for 204 hands of simulated play using Wincraps. It reflects approximately 2000 of my own tosses of the dice.
| Total Number of Hands | 204 |
| Total Number Of Rolls | 2043 |
| Average Number of Rolls | 9.88 rolls per hand per seven out |
| Overall Advantage Over the House | 7.47 % |
| Advantage On Place 5 | 15.26 % |
| Advantage On Place 6 | 6.77 % |
| Advantage On Place 8 | 9.5 % |
| Advantage On Place 9 | 2.69% |
| Advantage On Pass Line w/ Odds | 11.64 % |
| Advantage on C and E | – 12.32 % |
| Advantage on Horn | 8.49 % |
You’ll see that there’s a marked improvement from the previous data in my overall advantage despite only a slight improvement in the Average Number of Rolls per hand. How did this occur when my average number of rolls improved only slightly? Simple. I changed by betting. In my previous sample, I discovered that my post-come-out prop action was actually working against me. In this set of data, I made no post come out of prop bets. No horn, no hard ways, not even a field bet. Miraculously, my advantage and profitability skyrocketed. You’ll notice C and E and Horn wagers above. I still use the straight sixes on coming out, so I still make prop bets coming out. The negative advantage on the C and E is a bit misleading as any successful C and E wagers resulted in my making a horn bet instead of another C and E bet. Therefore, the important number to me is the advantage of Horn.
This data compiled from Dec. 2004- Feb. 2005
| Total Number of Hands | 200 |
| Total Number Of Rolls | 1912 |
| Average Number of Rolls | 9.56 rolls per hand per seven out |
| Overall Advantage Over the House | 9.39 % |
| Advantage On Place 5 | 5.35% |
| Advantage On Place 6 | 19.49 % |
| Advantage On Place 8 | 4.35 % |
| Advantage On Place 9 | 16.76% |
| Advantage On Pass Line w/ Odds | 7.62 % |
| Advantage on C and E | 18.52% |
| Advantage on Horn | 1.10% |
| Longest # of rolls | 51 |
| Most Passes | 12 |
| Come Outs | 567 |
| Come Outs Passed (7/11) | 146 ( 71 expected) |
| Come Outs Missed (2,3,12) | 70 (142 expected) |
Notes On this data: I’ve been tweaking both my set and my betting. Overall, I remain rather consistent, but my advantage has increased because I have incorporated a place-to-come strategy. Also, I changed the permutation of my come-out set. I successfully rolled tons of come-out naturals, but I LOST some of my come-out trash. I may have to rethink my come-out strategy… AGAIN.

